Traders and financial analysts are constantly seeking strategies that can provide them with an edge in the currency market. Technical analysis is one of the most powerful tools. In this blog post, we will learn about technical analysis, a useful tool that helps traders make smart choices based on past prices and market trends. If you are an experienced trader or just starting out, you can learn useful tips and examples from this guide to improve your trading.
Introduction to Technical Analysis in Trading
Technical analysis is a method used by traders to predict the future price movements of currencies by looking at past market data, mainly price and volume. Unlike fundamental analysis, which examines economic indicators, technical analysis focuses on patterns and trends that can offer insights into market behavior.
Knowing how to use technical analysis can be a game-changer for traders. By recognizing patterns and utilizing indicators, it is possible to make more informed decisions and potentially enhance your profitability. This guide will provide an introduction to the essential components of technical analysis of the currency market, from the basics to the advanced strategies.
Understanding the Basics: Candlestick Patterns, Support, and Resistance
Candlestick patterns are an important part of analyzing technical information. These patterns show price movements within a specified period of time and can help traders see potential reversals or continuations in the market.
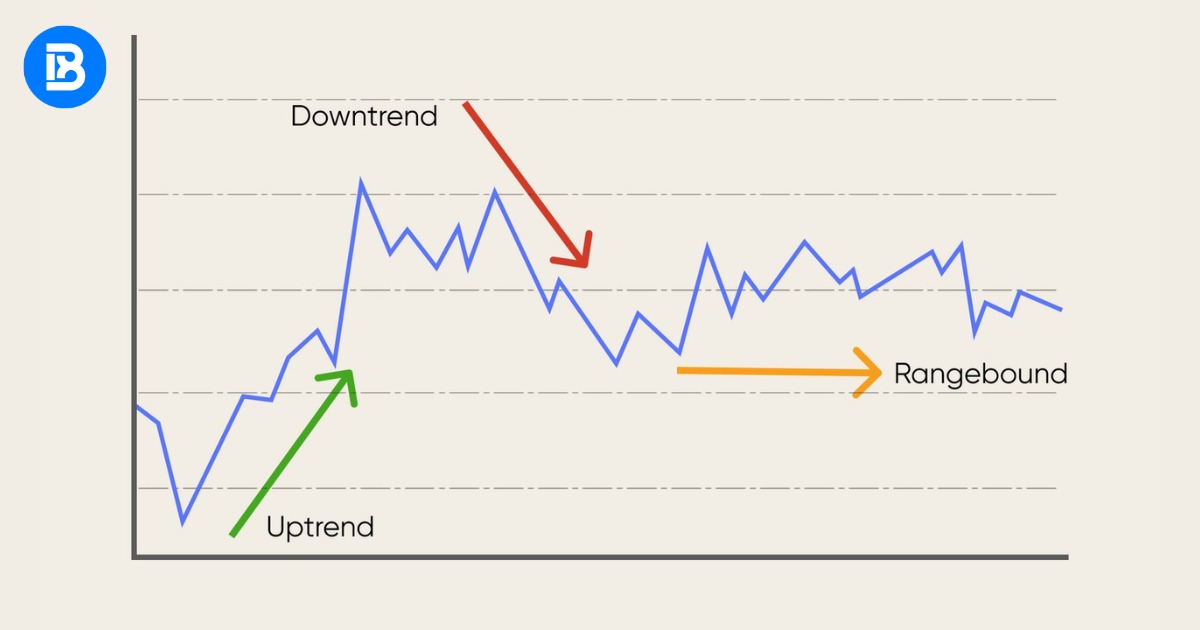
Trends show how a currency pair’s price moves over a certain period of time. It is helpful to identify whether the market is in an uptrend, downtrend, or ranging in order to make better predictions about future price movements. On the other hand, support and resistance levels are price points at which the currency pair has a tendency to reverse or pause. Understanding these levels can help you figure out entry and exit points and minimize potential losses.
By combining candlestick patterns with support and resistance levels, you can get a better idea of how the market is feeling and how prices might increase or decrease. This foundational knowledge sets the stage for advanced technical analysis techniques.
Introduction to Indicators: Moving Averages, RSI, MACD
Indicators are mathematical calculations based on price, volume, or open interest that traders use to predict future price movements. The Relative Strength Index (RSI) measures the speed and change of price movements, while moving averages smooth out price data to identify trends.
The Moving Average Convergence Divergence (MACD) is another indicator that helps traders understand the relationship between two moving averages. These indicators can be used separately or together to provide more robust trading signals.
Knowing how to interpret and utilize these indicators is crucial for making educated trades. Knowing when and how to use each indicator can set you apart from other traders, as each has its strengths and weaknesses.
Analyzing Price Patterns for Market Entry and Exit
Price patterns are patterns created by the price of a currency pair on a chart. These patterns can provide useful insights into market sentiment and potential future price movements. Head and shoulders, double tops and bottoms, and triangles are some common pricing patterns.
There are three peaks in the head and shoulders patterns, with the middle peak being the highest and the other two being lower. Double tops and bottoms signal potential trend reversals, with the price forming two consecutive peaks or troughs at the same level. There are triangles that can be ascending, descending, or symmetrical, and they signify periods of continuity before a move in either direction.
By understanding these patterns, traders can make better decisions about when to enter or leave the market.
The Role of Technical Analysis in Risk Management
Risk management is important for successful trading, and technical analysis can help with this. Using specialized tools and indicators, traders can spot potential hazards and devise strategies to mitigate them.
The stop-loss order, which closes a trade when the price reaches a certain level, is an important risk management tool. This helps to minimize potential losses and protect your capital. Also, technical analysis can help traders determine the right size position based on their risk tolerance and the volatility of the currency pair.
By using technical analysis in your plan to manage risk, you can reduce losses and make more money, which will help you succeed in the market for a long time.
Combining Fundamental and Technical Analysis for Better Predictions
While technical analysis looks at historical price data and market trends, fundamental analysis looks at the economic factors that affect currency prices. Combining these two methods can help you understand the market better and make better trading choices.
For example, Fundamental analysis looks at things like interest rates, inflation, and political stability, while technical analysis looks at price patterns and indicators. By combining both approaches, traders can develop a well-rounded strategy that considers different market influences.
Using both fundamental and technical analysis can help you make better trading predictions.
Tools and Resources for Aspiring Traders
Aspiring traders have the opportunity to utilize a variety of tools and resources to enhance their technical analysis abilities and enhance their trading performance. Some essential tools such as charting software, trading platforms, and educational resources.
Trading software such as TradingView and MetaTrader allows traders to analyze historical price data, apply technical indicators, and identify patterns. These platforms also give you real-time data and charts that make it easier to keep track of the market and make informed decisions.
Online courses, webinars, and forums can help traders learn more about technical analysis and improve their abilities. Websites like btcdana.com offer comprehensive tutorials and articles on various aspects of trading, including technical analysis.
By utilizing these tools and resources, aspiring traders can improve their knowledge and increase their chances of success in the market.
Conclusion
Technical analysis can be a powerful tool that can greatly enhance your trading strategy. You can make better trading decisions by knowing the basics, using key indicators, analyzing price patterns, and using risk management techniques.
Combining technical and fundamental analysis can help you predict market movements and succeed in the market. By learning and improving your strategy, you can stay ahead of the competition and succeed in the currency market.